DATA VISUALIZATION
We are dedicated to making data accessible, engaging, and meaningful for a wide range of audiences. Through thoughtful and innovative data visualization, we translate complex data relationships into clear, compelling narratives that foster understanding and insight. Our work goes beyond traditional charts and graphs, we employ a diverse range of formats including interactive maps, multimedia exhibitions, videos, and dynamic online storytelling platforms. Each project is tailored to its context and audience, ensuring that the insights drawn from data are not only accurate but also approachable and impactful. By combining analytical rigor with creative design, we bridge the gap between data and public understanding, empowering people to engage with information in new and meaningful ways.
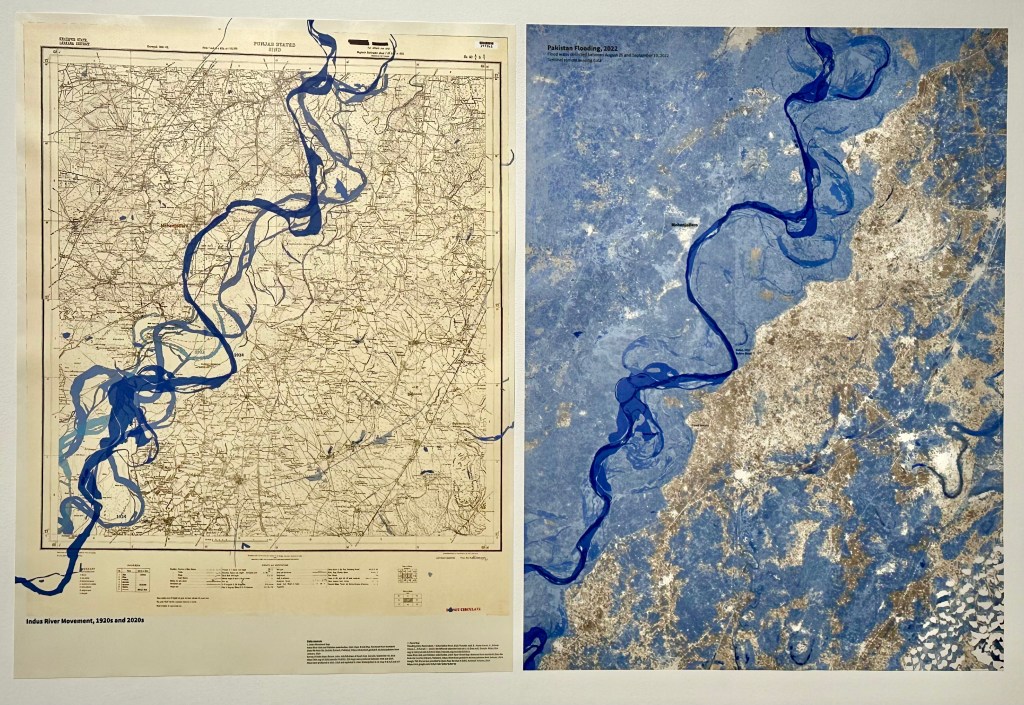
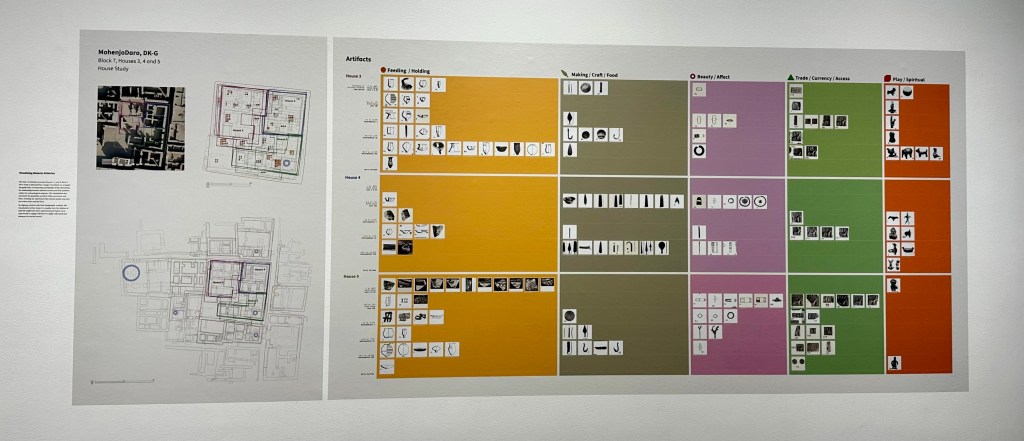

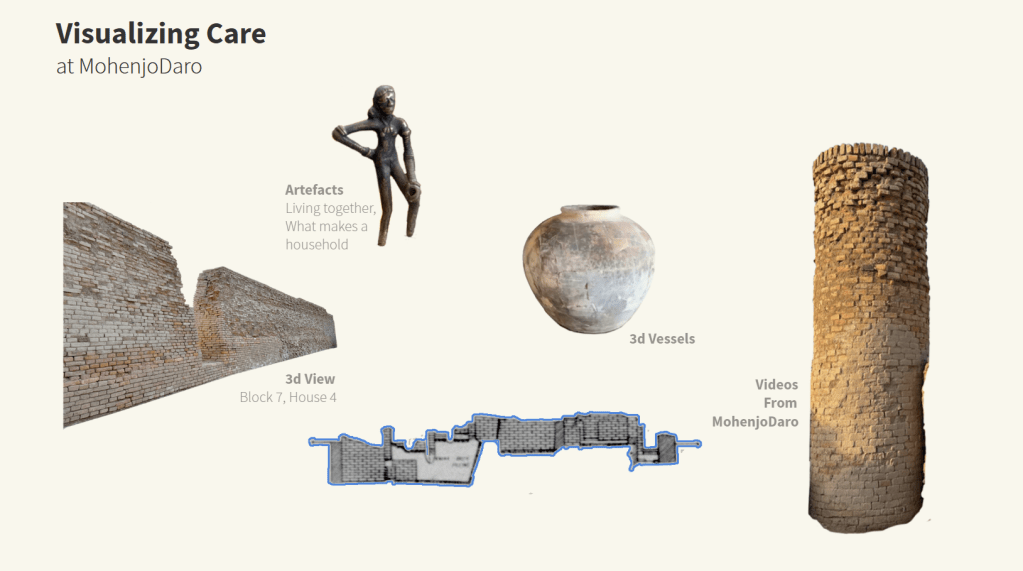
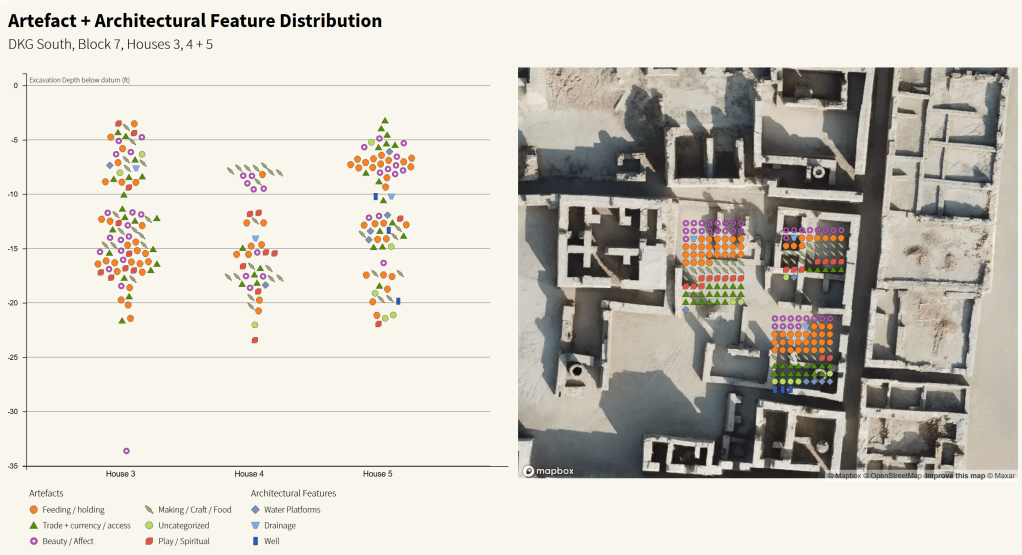
Data visualization posters from Visualizing Care: MohenjoDaro exhibition at Warehouse 50, Project Space at Alserkal Foundation Dubai, 2025.
Access Our Data on GitHub
Explore all the data we’ve collected, neatly organized into categories for easy navigation. Visit our GitHub repository to view the datasets.
3D Views
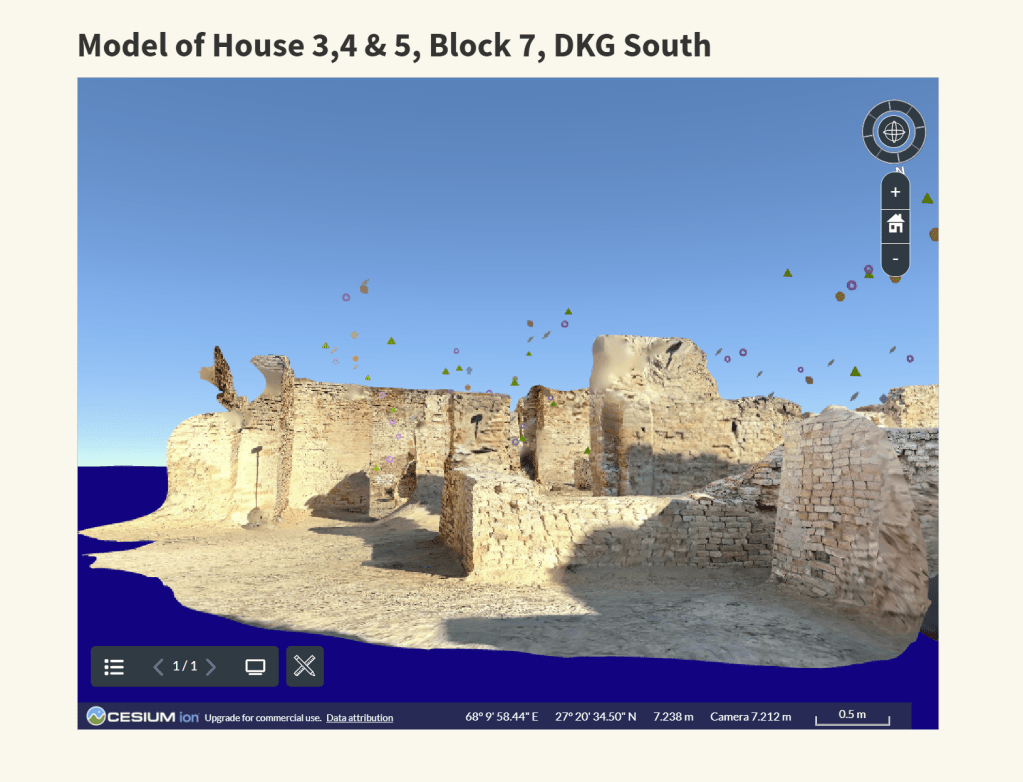
Block 7, House 4
Artefacts
3d Vessels

